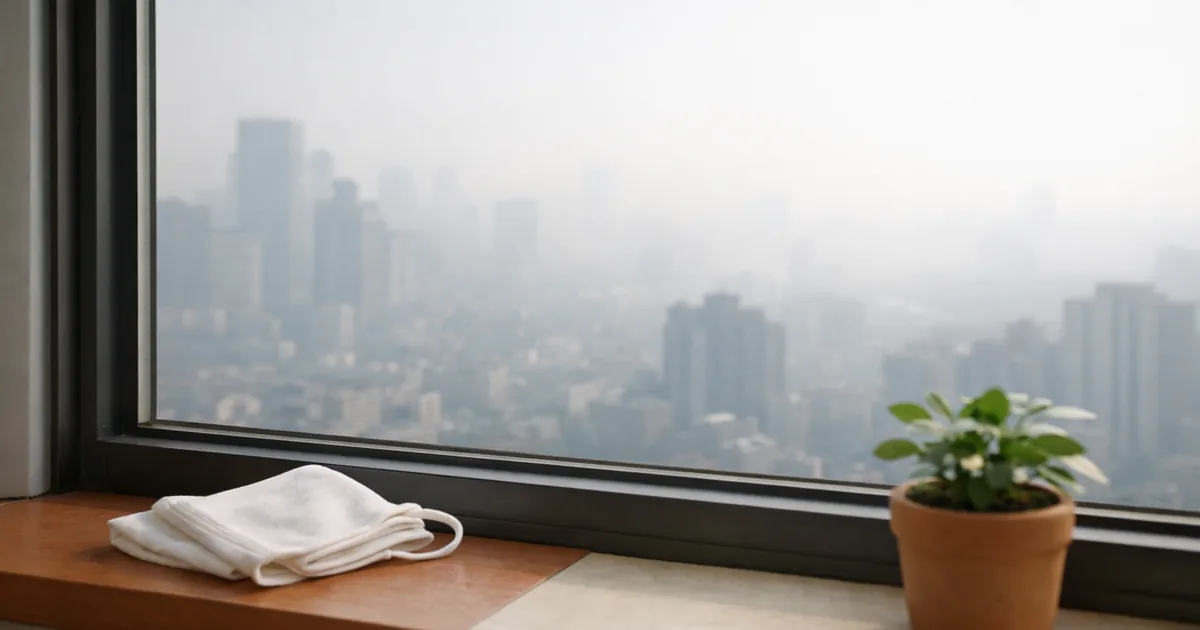
When the air quality app says “Moderate”, most people go out without thinking about it. “Bad” and they reach for a mask. But that grade table and the legal environmental standard are two different rulers.
Lay them side by side and the grade boundaries line up exactly with the legal limits for PM2.5 — and miss for PM10. The same word “Bad” means two different things.
1. “Moderate” is not safe. The top of the PM2.5 “Moderate” band is 35 µg/m³, and that figure is the legal 24-hour standard. “Moderate” means “today's limit has not been passed yet”.
2. “Bad” splits in two. PM2.5 “Bad” (from 36) is a day already over the legal limit. PM10 “Bad” (from 81) still has 19 µg/m³ to go before its limit of 100.
3. The 80 and 94 on masks are not the same test. KF80 blocks 80% of 0.6 µm particles; KF94 blocks 94% of 0.4 µm particles — different particle sizes.
The law sets only four numbers
Korea's ambient air quality standards sit in table 1 of the Enforcement Decree of the Framework Act on Environmental Policy, under the delegation in article 12(2). For dust there are four values.
| Pollutant | Annual mean | 24-hour mean |
|---|---|---|
| PM-10 | 50 µg/m³ or below | 100 µg/m³ or below |
| PM-2.5 | 15 µg/m³ or below | 35 µg/m³ or below |
| Decree table 1 (amended 1 Oct 2025). The notes to the same table define PM-10 as particles 10 µm or smaller and PM-2.5 as 2.5 µm or smaller. | ||
What gets missed here is that there is a separate annual figure. Meeting the daily number is not enough — the twelve-month average has to sit under its own line too. The table even states how compliance is judged: the 24-hour mean is tested at the 99th percentile, which allows for a handful of spikes.
The same table carries ozone (O3): 0.06 ppm over 8 hours, 0.1 ppm over 1 hour. If your throat is scratchy on a bright day when dust reads “Good”, ozone is the thing to look at — it rises with strong sunlight, moving opposite to dust.
The grades come from a different table
“Good, Moderate, Bad, Very bad” is not statutory language. It is the Comprehensive Air-quality Index (CAI), and AirKorea publishes the bands.
| Grade | Index | PM-10 | PM-2.5 |
|---|---|---|---|
| Good | 0–50 | 0–30 | 0–15 |
| Moderate | 51–100 | 31–80 | 16–35 |
| Bad | 101–250 | 81–150 | 36–75 |
| Very bad | 251–500 | 151–600 | 76–500 |
| Units µg/m³. AirKorea CAI guidance. | |||
For PM2.5 the two tables lock together

Overlaying the two tables gives this (our own comparison).
| Grade boundary | Value | The same value in the law |
|---|---|---|
| Top of “Good” | 15 µg/m³ | equals the annual standard |
| Top of “Moderate” | 35 µg/m³ | equals the 24-hour standard |
| Start of “Bad” | 36 µg/m³ | the first value past the 24-hour standard |
| So for PM2.5, “Bad” means “today has gone over the legal limit”. | ||
One more thing falls out of it. Assume every day sits at the top of “Moderate” and the annual average becomes 35 — 2.33 times the annual standard of 15 (our own working). A run of “Moderate” days does not keep the annual standard. Meeting it requires most days to be “Good”.
For PM10 they miss

| “Bad” begins at | 24-hour legal limit | Relation | |
|---|---|---|---|
| PM-2.5 | 36 µg/m³ | 35 µg/m³ | over |
| PM-10 | 81 µg/m³ | 100 µg/m³ | 19 to go |
| PM10 crosses its legal line in the middle of the “Bad” band (81–150). Its annual standard of 50 sits inside “Moderate” (31–80) (our own comparison). | |||
Which changes how you read the app.
- PM2.5 at “Bad” means the day is already past the legal limit. The grade can be taken at face value.
- PM10 at “Bad” may still be inside the limit. Read the number — 85 and 145 are the same grade and not the same day.
If the outdoor run is off, home workouts cover it, and for the stretch of days spent with the windows shut, indoor humidity is the subject of damp and mould.
If you only watch one
The legal definitions differ to begin with: PM-10 is 10 µm or smaller, PM-2.5 is 2.5 µm or smaller (notes to table 1). PM2.5 is the finer fraction contained inside PM10. The two are reported separately because particle size changes how deep they reach.
| PM-10 | PM-2.5 | |
|---|---|---|
| Definition | 10 µm or smaller | 2.5 µm or smaller |
| Annual standard | 50 µg/m³ | 15 µg/m³ |
| 24-hour standard | 100 µg/m³ | 35 µg/m³ |
| How strict | — | annual limit is one third of PM-10's |
| Within the same statutory table, the PM2.5 limits are set far lower. If you watch one number, watch PM2.5. | ||
KF80 and KF94 did not pass the same test
These are the mask grades published by the Ministry of Food and Drug Safety. The figures look like 80 versus 94, but the test particle size is different.
| Grade | Test particle size | Filtration |
|---|---|---|
| KF80 | mean 0.6 µm | 80% or more |
| KF94 | mean 0.4 µm | 94% or more |
| KF99 | mean 0.4 µm | 99% or more |
| MFDS drug safety portal, quasi-drug safety information. Only KF80 is tested at 0.6 µm. | ||
PM2.5 is defined as 2.5 µm or smaller, as above. The test particles at 0.4 and 0.6 µm are far smaller still — meaning every grade is tested well inside the PM2.5 size range. The difference between grades is not whether they filter but how tightly.

Common questions
It says “Moderate” but my throat hurts
The dust grade speaks only about dust. The same statutory table carries ozone (0.06 ppm over 8 hours) and nitrogen dioxide separately, and the CAI headline reflects whichever pollutant reads worst. Dust can be “Good” while something else is up.
What about indoors?
Table 1 sets standards for outdoor air. Indoor air is governed by a separate act, which this article did not examine.
Who is the annual standard binding on?
Environmental standards are framed as a level the state and local governments are to work toward, not a rule with penalties attached to individuals. They still tell you where the line of “no problem expected” sits.
Different apps show different numbers for the same day
Monitoring stations differ, and so does the averaging window (live / hourly / 24-hour). Before acting on a grade, check which station and which hour the figure comes from. To switch between stations and read the current value, use air quality where you are.
Sources used
- Statute — Enforcement Decree of the Framework Act on Environmental Policy, art. 2 and table 1 (amended 1 Oct 2025). Source for PM-10 50/100, PM-2.5 15/35, ozone 0.06/0.1 ppm and the particle-size definitions.
- Agency guidance — AirKorea, Comprehensive Air-quality Index. Source for the index and concentration bands behind Good / Moderate / Bad / Very bad.
- Agency guidance — Ministry of Food and Drug Safety, quasi-drug safety information. Source for the KF80 / KF94 / KF99 test particle sizes and filtration figures.
- Our own comparison — overlaying the grade boundaries on the legal limits, the finding that the top of “Moderate” is 2.33× the annual standard, and the 19 µg/m³ gap below PM10's limit are ours, worked out from the two tables above.
Where to check further
- Comparison with WHO guideline levels — we could not confirm it. We were unable to establish the WHO air quality guideline figures from a primary source we could read, so they are not in this article. Download the original from the WHO guidelines page if you need them. We did not copy figures quoted elsewhere.
- The reading where you actually are — pick your station on AirKorea. This article covers only how to read the standards and grades; live concentrations vary by station and hour.
- Indoor air is a different statute. Every figure here is an outdoor standard, and indoor air was not examined.
Written as of August 2026. The standards and particle-size definitions come from table 1 of the Decree, the grade bands from AirKorea, and the mask grades from the MFDS. The overlay comparison and figures such as 2.33× and 19 µg/m³ are our own working and are marked as such. Health decisions depend on individual circumstances and this does not replace medical care. If respiratory symptoms persist, see choosing between the ER and a clinic. For winter ventilation and heating alongside this, carbon monoxide alarm standards follows on; for the eye strain that comes with a long masked season, see easing eye strain.