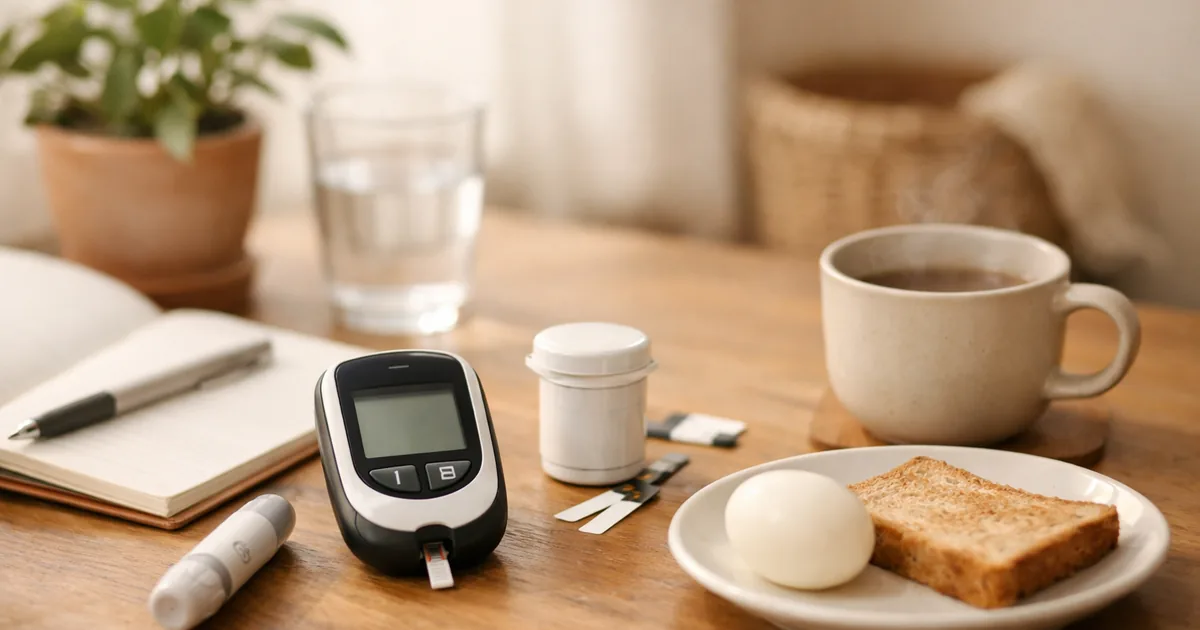
Ever glanced at a check-up result showing “fasting glucose 108” and moved on? It is a relief that it is not diabetes — but that number is already inside the table.
1. Where does my number sit. Fasting glucose of 100–125 is already in the prediabetes band (CDC). A1C: 5.7–6.4%. “Not diabetes, so fine” misreads it — you are already inside the table.
2. Waiting for symptoms is waiting too long. The CDC writes: “You can have prediabetes for years but have no clear symptoms.” The body gives no signal, so only the numbers tell you.
3. It can be reversed — by a lot. Lifestyle intervention cut progression to diabetes by 58%, and by 71% in people aged 60 and over, in the figures the CDC publishes. These are CDC thresholds, so the wording on a Korean check-up report may differ.
These are CDC figures. The wording on a Korean check-up report may differ, so have your own result interpreted by your clinician.
Where does my number sit
Copied from the CDC's diabetes testing page. The four tests each look at something different.
| Test | Normal | Prediabetes | Diabetes |
|---|---|---|---|
| A1C | Below 5.7% | 5.7 – 6.4% | 6.5% or above |
| Fasting blood sugar | 99 mg/dL or below | 100 – 125 | 126 or above |
| Glucose tolerance (2 hours) | 140 mg/dL or below | 140 – 199 | 200 or above |
| Random blood sugar | — | — | 200 mg/dL or above |

The band opens at 100. A fasting glucose of 108 does mean “not diabetes”. It does not mean “normal” — it is the middle of the prediabetes range.
Is no symptom the same as no problem
“You can have prediabetes for years but have no clear symptoms.”
“More than 2 in 5 American adults have prediabetes.”
— US Centers for Disease Control and Prevention, prediabetes page
Which makes the test number effectively the only signal. “I feel fine” carries no information here. That said, if several of the following overlap, it is worth checking.
- Unusual thirst and drinking more than usual
- Urinating often, including waking at night
- Tiredness after eating, heavy post-meal drowsiness
- Wounds healing slowly, or frequent skin infections
- The back of the neck or the armpits turning dark and thickened (acanthosis nigricans)
The last one is less known and it is visible. Darkening on the back of the neck that does not scrub off is worth having looked at.
Who should be tested without symptoms
The CDC's risk-factor list:
| Category | Factor |
|---|---|
| Weight | Being overweight |
| Age | 45 or older |
| Family history | A parent or sibling with type 2 diabetes |
| Activity | Physically active less than three times a week |
| Pregnancy-related | A history of gestational diabetes, or giving birth to a baby over 9 pounds |
| Related condition | Polycystic ovary syndrome (PCOS) |
| Race and ethnicity | African American, Hispanic or Latino, American Indian, Alaska Native, Pacific Islander and some Asian American people |
※ The last row is a US population classification. It is listed as printed and not interpreted for other populations.
Can it be reversed
This is the good news in the condition. The CDC puts the effect of a lifestyle-change programme like this:
Losing “around 5% to 7% of your body weight” can “lower your risk for type 2 diabetes by 58% (71% if you're over age 60).”
— US Centers for Disease Control and Prevention, prediabetes page

The benefit grows with age, which is the exact reverse of “it's too late for me now”. And 5–7% of 70kg is 3.5–5kg. That is not an extreme target.
What actually changes
| Change | Why | Backing |
|---|---|---|
| Activity three or more days a week | The CDC risk factor is exactly “less than three times a week” | CDC original |
| Lose 5–7% of body weight | Risk falls 58% (71% over age 60) | CDC original |
| Add strength work home workout basics · chair exercises | More muscle means more storage for glucose | NHIS webzine — twice a week |
| Change the order you eat in vegetables and protein first | The same meal raises glucose less | Commonly advised — unverified here |
| Walk 10–15 minutes after eating | Flattens the post-meal rise | Commonly advised — unverified here |
| Cut liquid sugar | Drinks and juices raise blood sugar fastest | Commonly described |
Weight and waist thresholds are in BMI and waist circumference; the rest of a check-up report in reading your results.

Questions this raises
My fasting glucose is normal. Am I clear?
Not necessarily. As the table shows there are three tests and they look at different things — fasting can read normal while only the two-hour glucose tolerance value crosses 140. If you carry risk factors, an A1C is worth adding.
What is A1C?
It reflects your average blood sugar over the past two to three months, so it is steadier than a single day's reading. On CDC thresholds, 5.7–6.4% is prediabetes.
Does prediabetes mean medication?
What the CDC presents is a lifestyle-change programme, with the 58% (71% over 60) effect above. Whether medication applies depends on your risk profile — discuss it at your appointment.
How often should I retest?
The CDC page does not state a retest interval. Set it with your clinician.
The WHO says to keep free sugars under 10% of daily energy — 50g, about 12 teaspoons, at 2,000 calories (how much sugar a day).
Sources
- US Centers for Disease Control and Prevention — Diabetes Testing (last reviewed 15 May 2024). Source of the complete normal / prediabetes / diabetes ranges for A1C, fasting blood sugar, glucose tolerance and random blood sugar.
- US Centers for Disease Control and Prevention — Prediabetes – Your Chance to Prevent Type 2 Diabetes (last reviewed 30 November 2023). Source of “you can have prediabetes for years but have no clear symptoms”, “more than 2 in 5 American adults”, the risk-factor list, and 5–7% weight loss cutting risk by 58% (71% over 60).
- National Health Insurance Service (Korea) — health insurance webzine, “healthy dieting by keyword” (July 2024). Source of the Korean weight-management targets — 300–500 kcal a day, aerobic exercise five times a week or 200–300 minutes, strength work twice a week, 5–10% over six months.
Where to check further
- Whether Korean diagnostic thresholds match the CDC table. These are CDC figures and we could not verify Korean check-up criteria against a public-agency source — the verdict wording on your own result and the Korean Diabetes Association guidelines carry the Korean position.
- Retest intervals, and the source for the symptom list. The CDC page gives no retest interval and in fact states that there are no symptoms, so the list here is the description in common use — ask your screening centre or clinician when to retest.
- Prediabetes prevalence in Korea. Looked at again on 21 September 2026. Statistics Korea is now the Ministry of Data and Statistics (mods.go.kr) and it opens; its indicator site carries “diabetes prevalence” sourced from the KDCA National Health and Nutrition Examination Survey (updated 7 March 2026). But that indicator is diabetes, not the pre-diabetes band this article is about, The KDCA health portal came back on 22 September 2026, and its feature “Can prediabetes be reversed?” (31 October 2022) states that “about 15.83 million people” in Korea have prediabetes (alongside 6 million with diabetes as of 2021) and that “about 8% of people with prediabetes progress to diabetes each year”. It is a 2022 feature that does not name the underlying survey, so the figure still needs matching against the survey’s own tables.
Written as of July 2026. The threshold table, the symptom-free statement, the prevalence figure, the risk factors and the 58% / 71% reductions all come from the CDC pages above. This is general health information and does not replace medical diagnosis or treatment. Interpretation of your results and any treatment plan belong with your clinician.